
biopalette
Image-Inspired Color Palettes for Biomedical Visualization


📚 Documentation • 💬 Issues • 🎨 Tessera • 🧪 Palette Lab
Languages: English | 简体中文
📚 Documentation • 💬 Issues • 🎨 Tessera • 🧪 Palette Lab
Languages: English | 简体中文
biopalette is an R package providing image-inspired color palettes for biomedical visualization.
Every palette begins with a real image — a film still, a scientific figure, an artwork — and is translated into a reproducible color system. The source is always documented: where the colors came from, what they mean, and when to use them.
library(biopalette)

get_palette("babel", n = 5)
get_palette("three_body")
get_palette("walter_white", type = "diverging")

preview_palette("gene_red")
palette_gallery()

# Discrete and continuous ggplot2 scales
scale_color_biopalette("three_body")
scale_fill_biopalette_gradient("mitonuclear_blue")# Development version
devtools::install_github("evanbio/biopalette")Requires: R ≥ 4.1.0
Each name links to its source page — source image, color table, and intended use.
| Name | Type | Colors | Recommended use | Source |
|---|---|---|---|---|
gene_red |
Qualitative | 2 | Emphasized signal versus a dark or neutral counterpart | Better Call Saul — Gene Takavic’s red coat |
walter_white |
Diverging | 5 | Signed continuous values around a neutral center | Breaking Bad — desert to sky |
walter_white2 |
Qualitative | 5 | Up to five unordered groups | Breaking Bad — muted earth tones |
walter_white3 |
Diverging | 5 | Warm-register signed continuous values | Breaking Bad — warm counterpart |
babel |
Qualitative | 21 | Many categorical groups with labels or position support | Pan-cancer myeloid atlas (Cell, 2021) — 22 cell types, 21 voices |
bcell_atlas |
Qualitative | 7 | Four-to-seven categorical groups with direct labels or position support | Pan-cancer B-cell atlas (Cell, 2024) — graphical abstract |
bcell_atlas2 |
Diverging | 5 | Signed change between warm and cool biological states | Pan-cancer B-cell atlas (Cell, 2024) — IgA to IgG shift |
bcell_clusters |
Qualitative | 20 | Many labeled categorical groups with position or faceting support | Pan-cancer B-cell atlas (Cell, 2024) — Figure 1B cluster legend |
three_body |
Qualitative | 3 | Three groups, lineages, or trajectories | Pan-cancer myeloid atlas (Cell, 2021) — three DC trajectories |
mitonuclear_blue |
Sequential | 6 | Cool low-to-high continuous values | Mito-nuclear communication in aging (TIBS, 2022) — young blue |
mitonuclear_orange |
Sequential | 6 | Warm low-to-high continuous values | Mito-nuclear communication in aging (TIBS, 2022) — aged orange |
heat_light |
Qualitative | 2 | Paired categories or experimental conditions | Bond ampholysis (Nature, 2024) — heat and light turn radicals into an ion pair |
tam_pastel |
Qualitative | 6 | Four-to-six categorical groups on light backgrounds | Pan-cancer myeloid atlas (Cell, 2021) — soft TAM states |
cancer_mosaic |
Qualitative | 15 | Ten-to-fifteen categories with labels or position support | Pan-cancer myeloid atlas (Cell, 2021) — cancer-type mosaic |
lactate_steps |
Qualitative | 5 | Five discrete workflow stages or study groups | Lactate metabolism and immunotherapy (JECCR, 2024) — five study stages |
biopalette provides the R interface for retrieving and applying image-inspired palettes. Tessera documents their source images, example data, and reproducible R figure recipes. Palette Lab keeps the data and graphical structure fixed while comparing palette behavior across 17 graphical contexts. The overview and panels below are rendered from Palette Lab; Tessera links provide the corresponding figure recipes and data context.
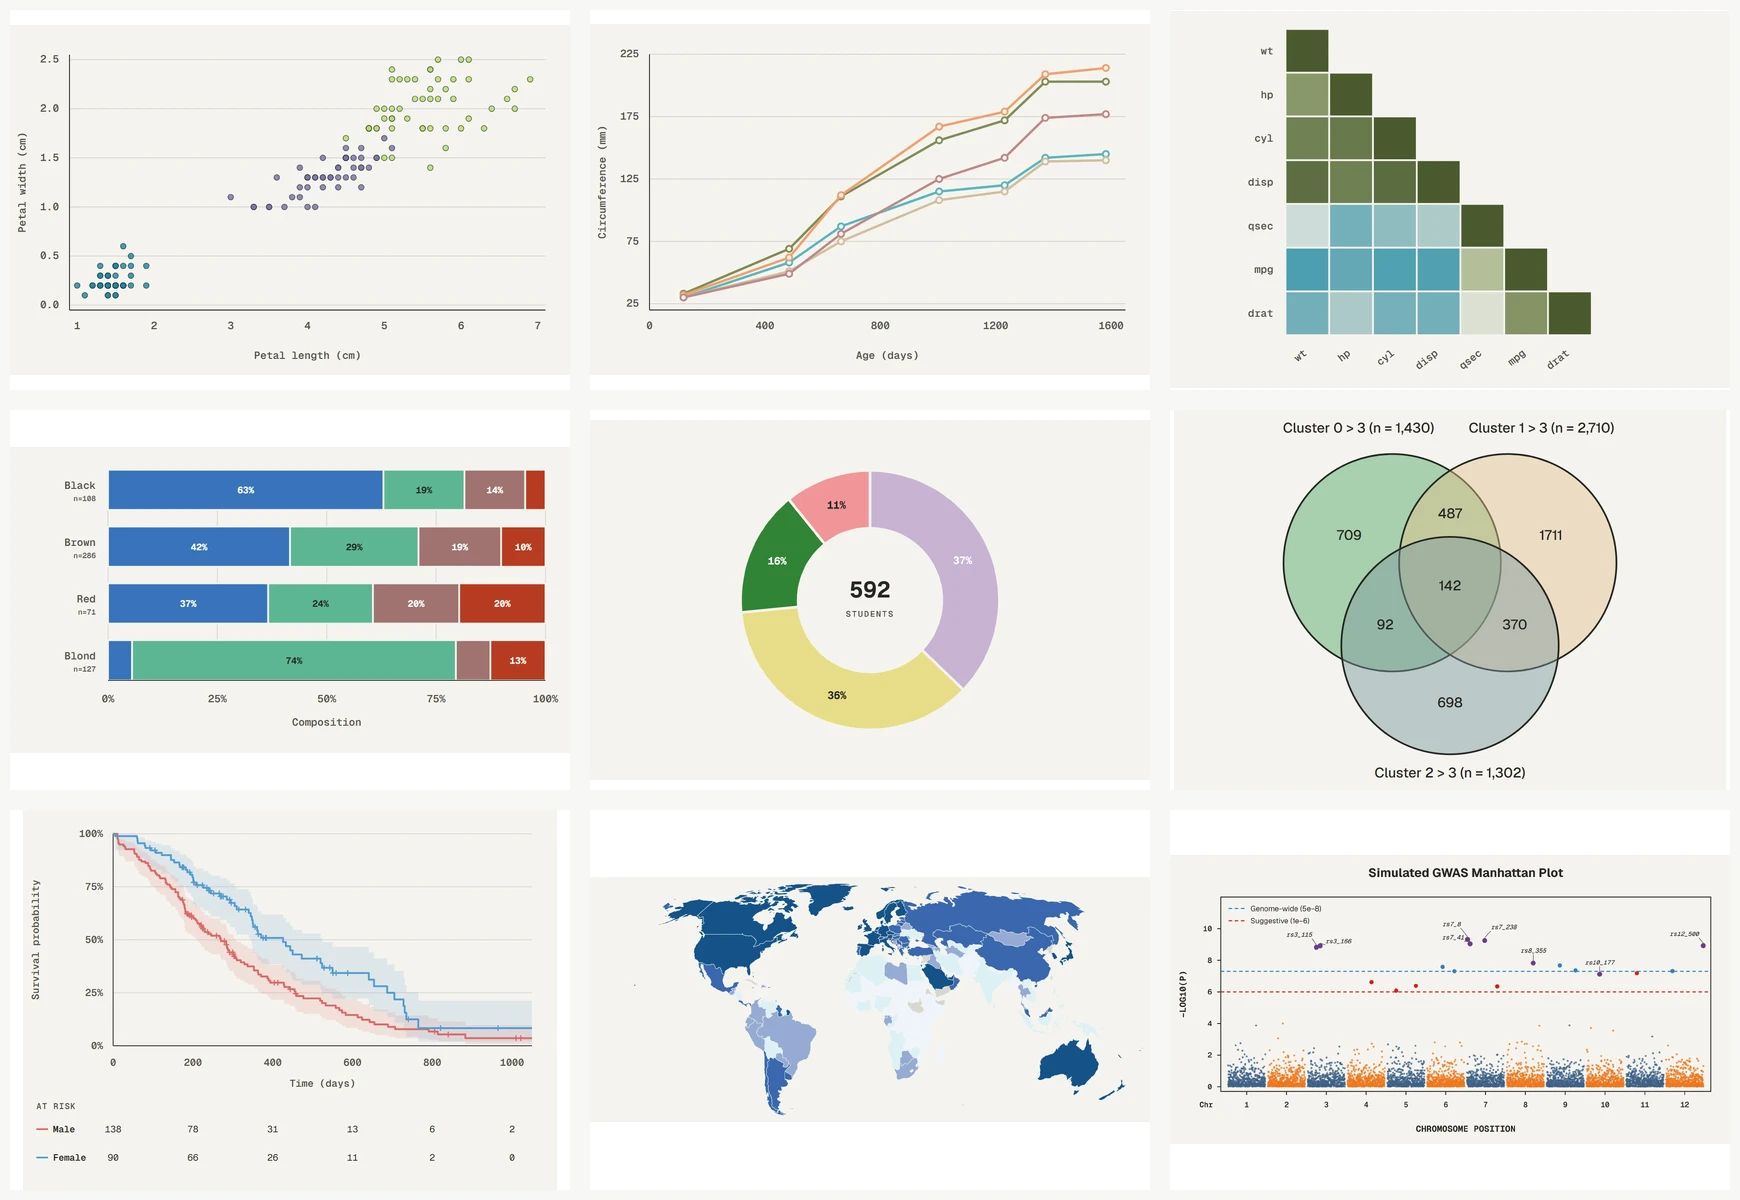
The same palette can behave differently as points, lines, filled regions, heatmap cells, set overlaps, survival curves, or genome-wide signals. These examples show the kinds of figures available through the Tessera recipes and the corresponding palette comparisons in Palette Lab.
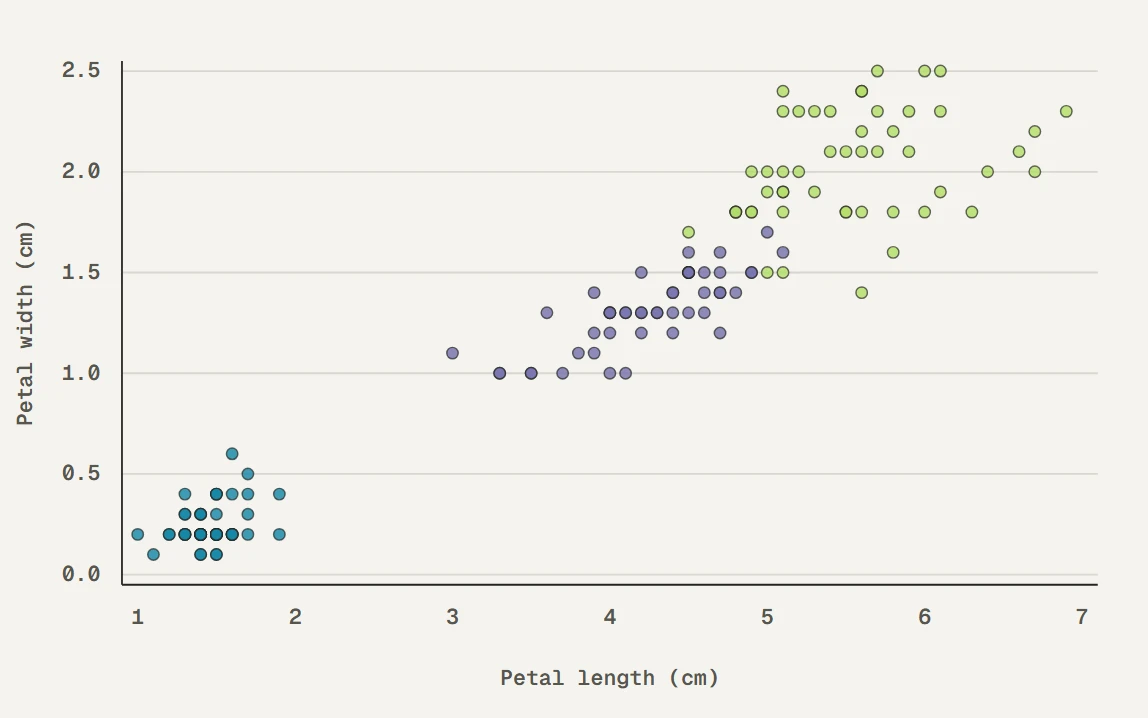
Grouped scatter · babel
|
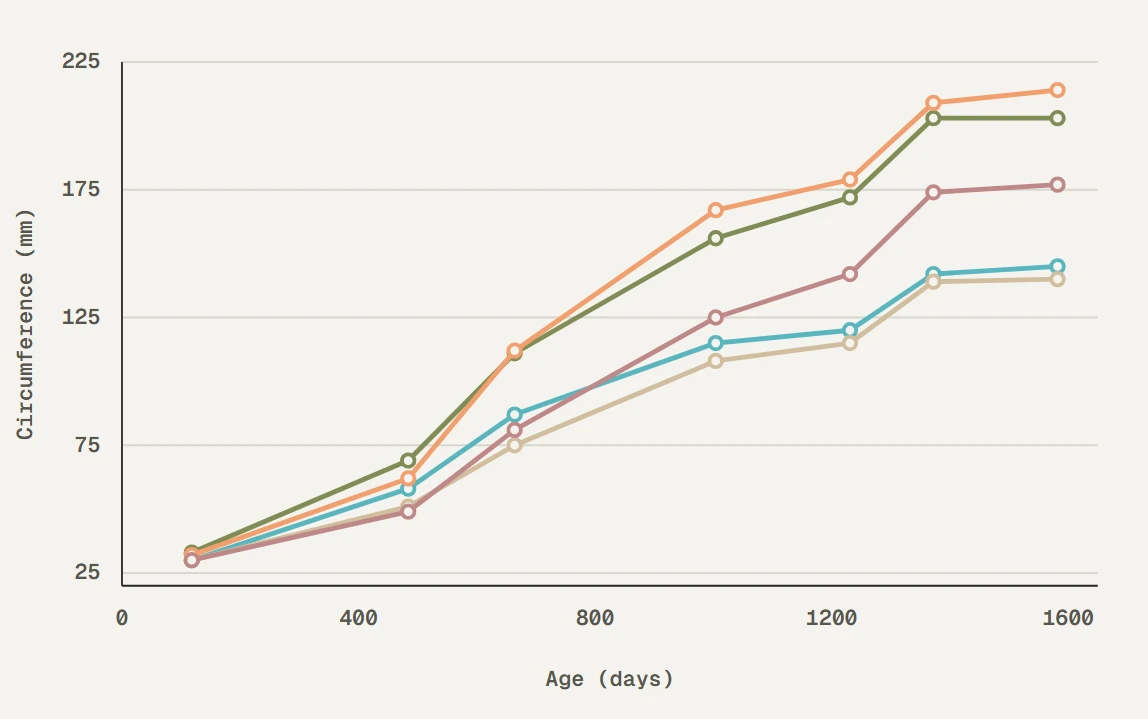
Multi-line comparison · walter_white2
|
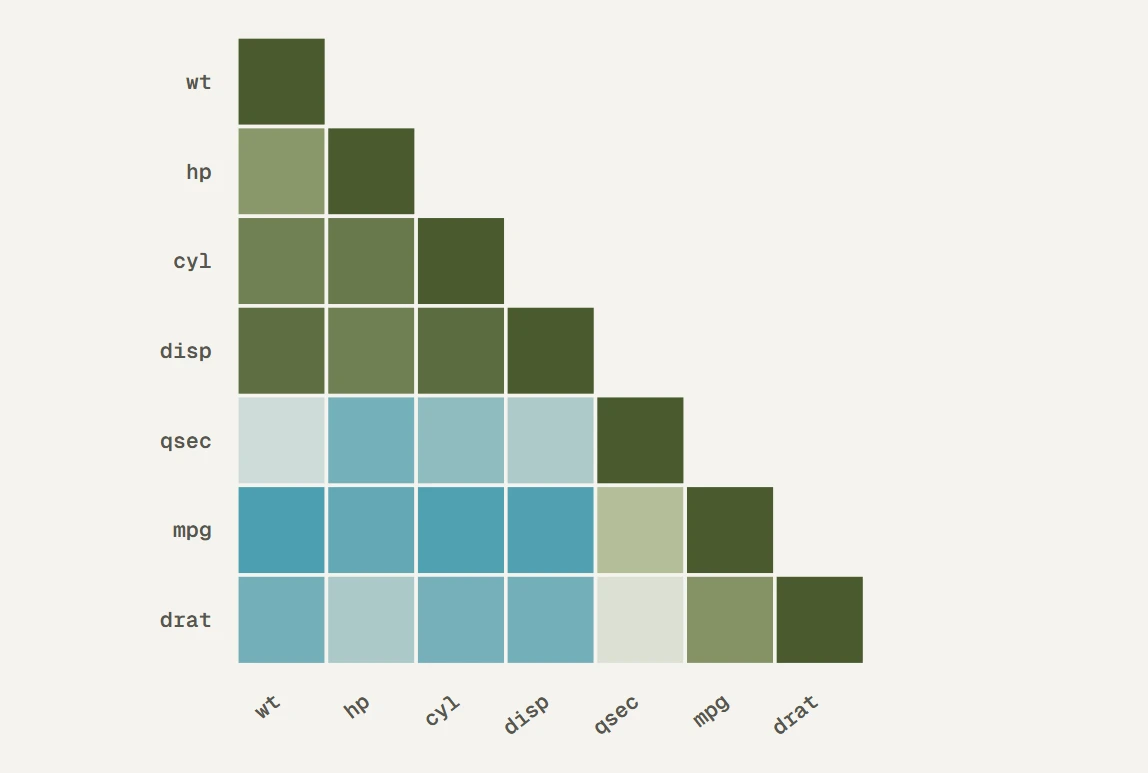
Correlation heatmap · walter_white
|
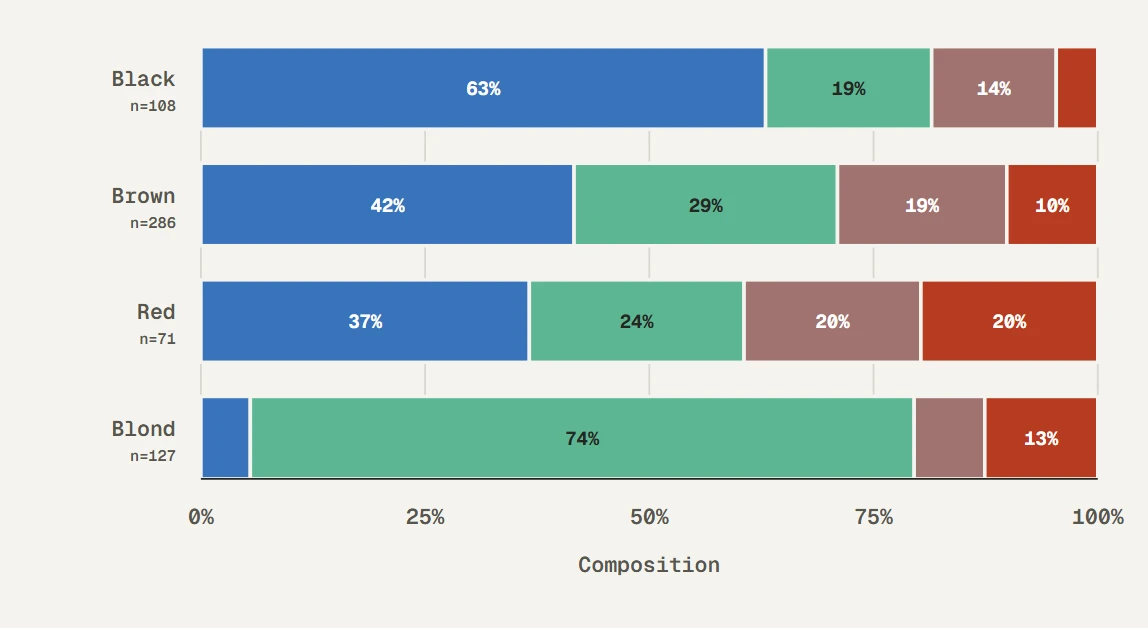
Eye color composition by hair color · lactate_steps
|
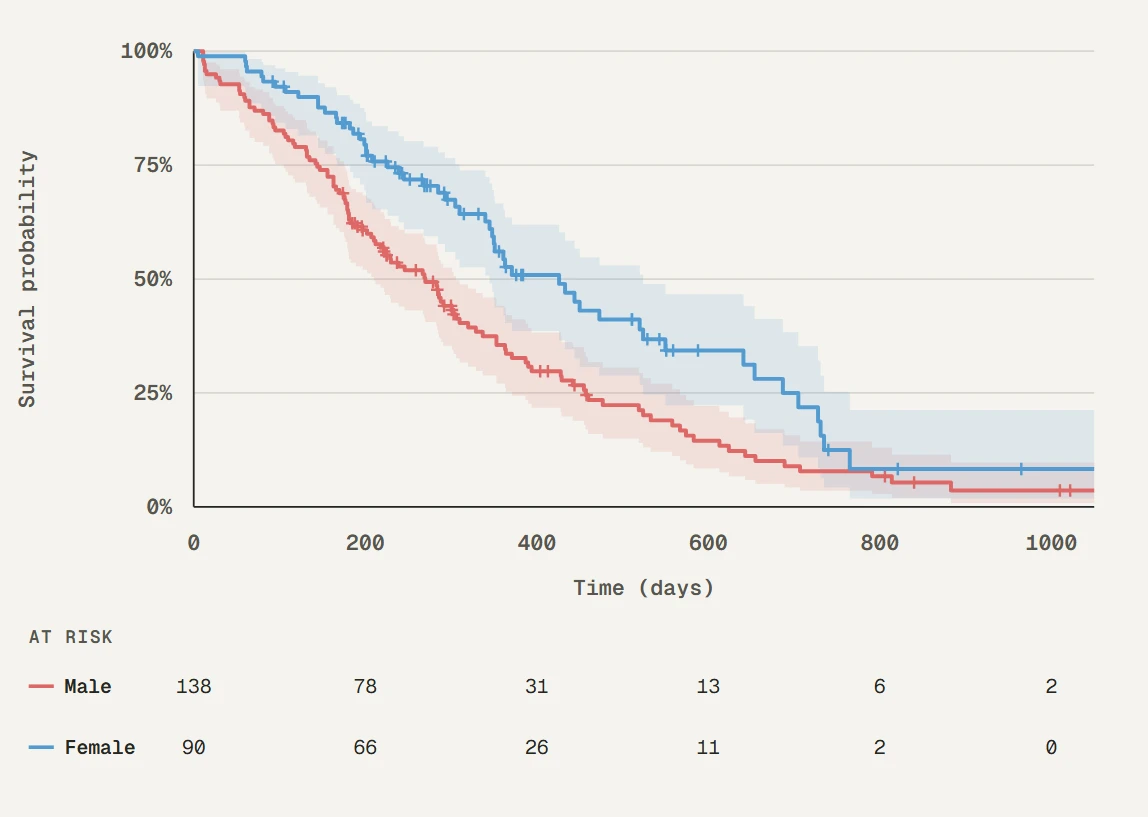
Kaplan–Meier survival curve · heat_light
|
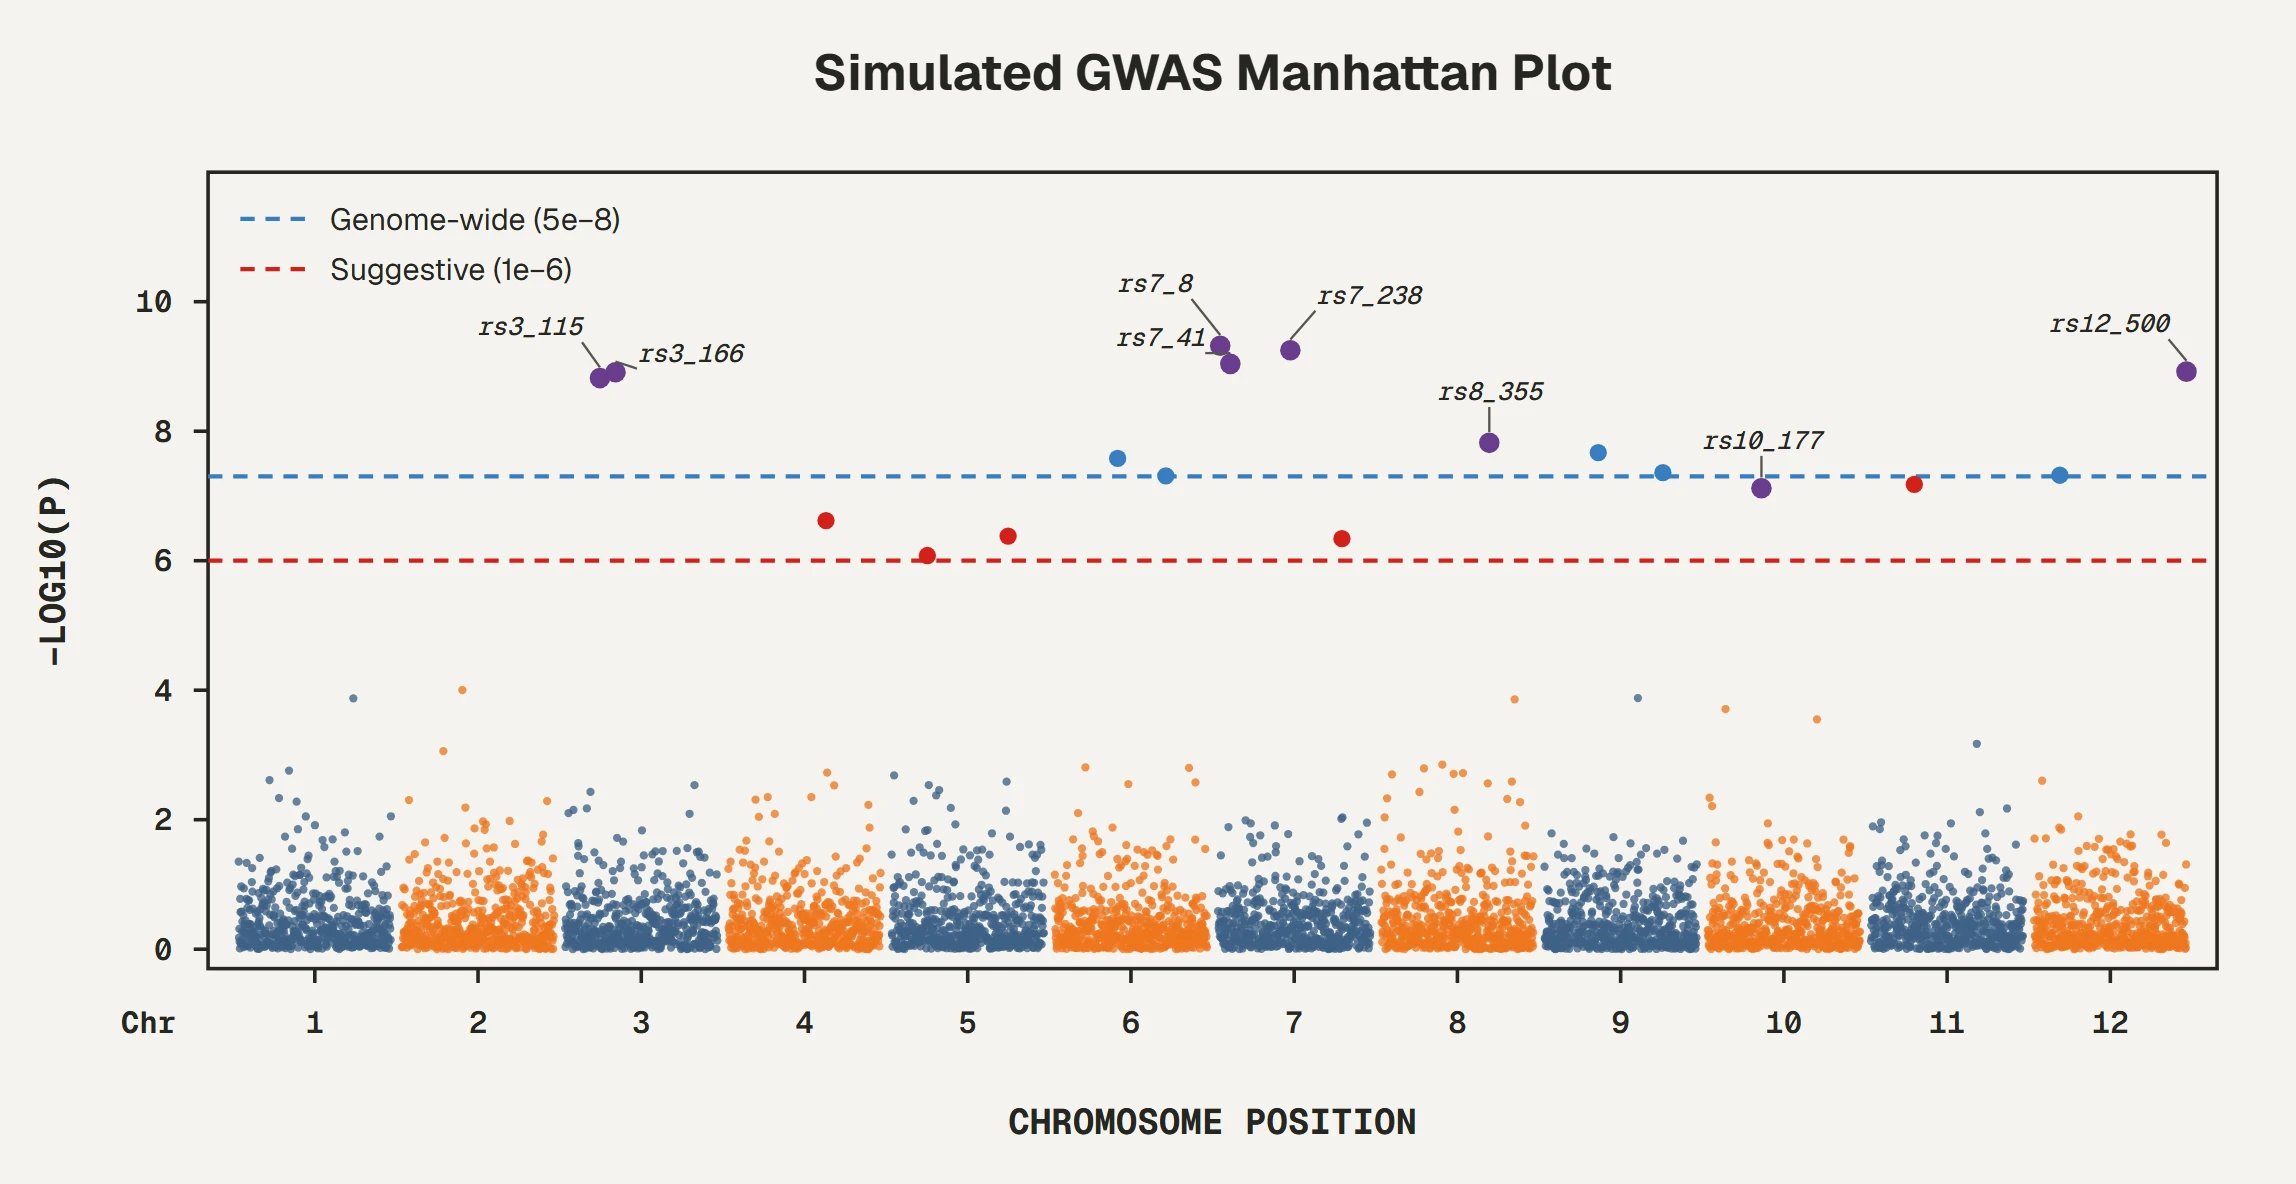
Manhattan plot · cancer_mosaic
|
get_palette() — retrieve colors by name, type, and
sizepalette_info() — metadata for one named palettelist_palettes() — data frame of all available
palettespalette_gallery() — paged visual gallery of all
palettescreate_palette() — write a new palette to JSONremove_palette() — remove a palette by namepreview_palette() — render color swatches to a
plotscale_color_biopalette() /
scale_colour_biopalette() — discrete color scalesscale_fill_biopalette() — discrete fill scalesscale_color_biopalette_gradient() /
scale_colour_biopalette_gradient() — continuous color
gradientsscale_fill_biopalette_gradient() — continuous fill
gradientshex2rgb() — convert HEX to RGBrgb2hex() — convert RGB to HEXMIT License © 2025–2026 Yibin Zhou
Made with care by Yibin Zhou