An R package for estimating the regeneration potential using large scale inventory information.
Regeneration datasets, especially those pertaining to rare tree
species, often exhibit values that are below the real regeneration
potential due to various factors influencing or hindering natural
regeneration. The R package quaxnat implements a quantile
regression approach for estimating the regeneration potential, following
the methodology of Axer et
al. (2021). This quantile regression method quantifies the impact of
the distance to the nearest seed source on natural regeneration
densities not considering other influencing variables. The function
quax we provide is a simple implementation of the quantile
estimation. It presents a rather naive approach to quantile regression
and, while likely outperformed by more sophisticated procedures such as
those in the R package quantreg (Koenker et al.,
2023) in general quantile regression problems, appears to work
reasonably well in the situation considered here.
The package provides various dispersal kernels that have proven useful in modeling seed dispersal:
Within the quax function the dispersal kernel is defined
by fun. Additional kernels can be provided as user-defined
functions.
The stable version can be installed from CRAN
install.packages("quaxnat")and the development version is available from Github
remotes::install_github("MaximilianAxer/quaxnat")This section illustrates the use of the quax function with step-by-step explanations of the computation.
# Load quaxnat package
library(quaxnat)

# Load example data
data("regeneration")
After loading the quaxnat package, we are now ready to apply
the quax function, which we do for example for the
.995th quantile and five dispersal kernels implemented in
quaxnat.
# Estimate regeneration potential based on various dispersal kernels
tau <- 0.995
f1 <- quax(oak_regen ~ distance_oak, regeneration, tau=tau, fun=k_t)
f2 <- quax(oak_regen ~ distance_oak, regeneration, tau=tau, fun=k_weibull)
f3 <- quax(oak_regen ~ distance_oak, regeneration, tau=tau, fun=k_lognormal)
f4 <- quax(oak_regen ~ distance_oak, regeneration, tau=tau, fun=k_power)
f5 <- quax(oak_regen ~ distance_oak, regeneration, tau=tau, fun=k_exponential_power)

f <- list(`Spatial t`=f1, Weibull=f2, Lognormal=f3, Power=f4, `Exp. Power`=f5)
The results of the quantile regression for the different dispersal
kernels can be visualised and compared. We are now ready to add the
estimated functions to the plot. Since quax directly
returns those functions, this is conveniently done with the
curve function.
# Plot regeneration density as a function of the distance to the nearest seed tree
plot(oak_regen ~ distance_oak, regeneration, xlim=c(0, 1500), cex=0.8,
     xlab="Distance to nearest seed tree", ylab="Regeneration density")

# Add estimated functions to diagram
col <- hcl.colors(length(f), palette="Dynamic")
for (i in seq_along(f)){
  curve(f[[i]](x), add=TRUE, n=10000, col=col[i], lwd=2)
}
legend("topright", title=paste0(tau," quantile"),
       legend=names(f), lty=1, lwd=2, col=col)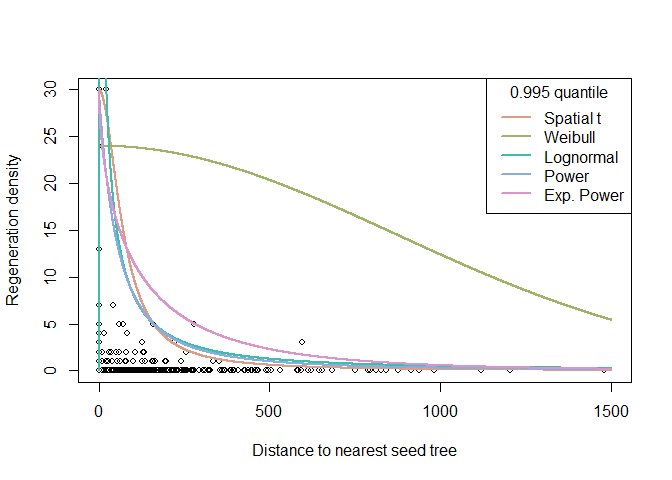
For the quax objects returned by the quax
function, summary outputs the estimated coefficients and
the attained value of the objective function. The latter can be used to
compare fits of different dispersal kernels for the same quantile to the
same data.
# Compare quality of fits
sapply(f, summary)
#>              Spatial t Weibull   Lognormal Power     Exp. Power
#> coefficients numeric,2 numeric,2 numeric,2 numeric,2 numeric,2
#> value        45.99978  151.7906  131.241   45.92098  46.46311
A prediction for the entire study area is made with the
predict_quax function. A distmap with
distances to the nearest seed tree is used for the prediction of the
potential regeneration densities. Furthermore, the parameterized
quax object is used for the prediction.
# Create raster data set as prediction area
set.seed(20240606)
rr <- terra::rast(matrix(sample(0:10, 20 * 20, replace = TRUE), nrow = 20, ncol = 20))

# Compute distances to seed trees for prediction area
dists <- seed_tree_distmap(raster = rr, species = "10")

# Predict the potential regeneration density
regen_dens <- predict_quax(dists, f5)
terra::plot(regen_dens)
GPL (>=2)
Axer et al. “Modelling potential density of natural regeneration of European oak species (Quercus robur L., Quercus petraea (Matt.) Liebl.) depending on the distance to the potential seed source: Methodological approach for modelling dispersal from inventory data at forest enterprise level.” Forest Ecology and Management 482 (2021): 118802.
Koenker et al. “Package ‘quantreg’.” Reference manual available at CRAN: https://cran.r-project.org/package=quantreg (2023).