The goal of rbcmodel is to allow easier quantitative evaluation of ribulose 1,5-bisphosphate carboxylase/oxygenase (Rubisco) net carbon fixation rates. The package contains a database of ~1500 Michaelis-Menten kinetics (kcat,C, KC, KO, and SC/O) measurements and ~200 temperature scaling factors that can be used to build a Michaelis-Menten function for a particular Rubisco enzyme. Given a CO2, O2, and temperature value, this function provides a rate of net carbon fixation per active site, including the loss of carbon that results from the recycling process for the oxygenation product (also called phosphoglycolate salvage).
You can install the CRAN release (v.1.0.0) of rbcmodel from CRAN with:
install.packages("rbcmodel")Alternately, the development version of rbcmodel can be installed from GitHub with:
# install.packages("pak")
pak::pak("keharr/rbcmodel")To build a Rubisco enzyme, you need three components: the kinetics, the temperature scaling factors for those kinetics, and a stoichiometry for the phosphoglycolate salvage.
library(rbcmodel)
#call kinetics object from database
ex_kinetics<-Enzyme("average_Rubisco")
#call temperature scaling object from database
ex_DHScale<-DHScale("average_Rubisco_dH")
#build enzyme function
ex_Rbc<-CO2_dependence(ex_kinetics,ex_DHScale,PGS="canon")
Once the enzyme function is created, it can be used to calculate a single rate:
#calculate rate at 150uM CO2, 200uM O2, and 15C
ex_Rbc(150,200,15)
#> [1] 1.204452
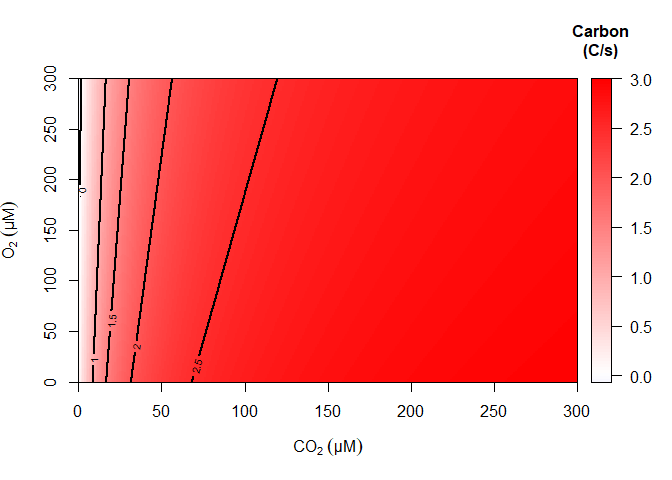
Or plotted across a 3D grid of values and sliced at one of the three variables to visualize it:
#create sequence of the three variables
CO2_seq<-O2_seq<-seq(0,300,by=1)
T_seq<-seq(0,40,by=1)
#create grid
ex_grid<-make_4D_grid(ex_Rbc,CO2_seq,O2_seq,T_seq)
#slice grid at 25C
ex_slice<-slice_4D_grid(ex_grid,dim=3,val=25)
#plot slice
plot_slice_3D(ex_slice,contours=c(0,1,1.5,2,2.5),xlabel=expression(CO[2]~(μM)),ylabel=expression(O[2]~(μM)))
An enzyme function can also be compared with any other enzyme function to calculate or plot the difference in the two rates instead, which is explored in the basic rbcmodel vignette “Introduction”, which also contains a more thorough explanation of the basic process of finding kinetics and a temperature scale to use, creating the enzyme function, and then creating plots.