![]()
![]()
![]()

![]()
![]()
{{ packagename }} is developed at Pontificia Universidad Javeriana as part of the Epiverse-TRACE initiative.
{{ packagename }} is an R package that offers tools for estimating vaccine effectiveness (VE), using a series of epidemiological designs including cohort studies, test-negative case-control, and screening methods (Halloran, Longini, and Struchiner 2010). The current version of the package provides a set of features for preparing, visualizing, and managing cohort data, estimating vaccine effectiveness, and assessing the performance of the models. Test-negative design and screening method will be included in future versions.
Our stable versions are released on CRAN, and can be installed using:
install.packages("vaccineff", build_vignettes = TRUE)The current development version of {{ packagename }} can be
installed from GitHub using the
pak package.
if(!require("pak")) install.packages("pak")
pak::pak("{{ gh_repo }}")
Or using the remotes package
if(!require("remotes")) install.packages("remotes")
remotes::install_github("{{ gh_repo }}"){{ packagename }} provides a minimal cohort dataset that can be used to test out the models.
# Load example `cohortdata` included in the package
data("cohortdata")
head(cohortdata, 5)
#>         id sex age death_date death_other_causes vaccine_date_1 vaccine_date_2
#> 1 04edf85a   M  50       <NA>               <NA>           <NA>           <NA>
#> 2 c5a83f56   M  66       <NA>               <NA>           <NA>           <NA>
#> 3 82991731   M  81       <NA>               <NA>           <NA>           <NA>
#> 4 afbab268   M  74       <NA>               <NA>     2021-03-30     2021-05-16
#> 5 3faf2474   M  54       <NA>               <NA>     2021-06-01     2021-06-22
#>   vaccine_1 vaccine_2
#> 1      <NA>      <NA>
#> 2      <NA>      <NA>
#> 3      <NA>      <NA>
#> 4    BRAND2    BRAND2
#> 5    BRAND1    BRAND1
The function make_vaccineff_data allows defining
different aspects of the study design—such as vaccination dates,
immunization delays, and potential confounding factors—and creates an
object of class vaccineff_data. Its output is used to
estimate VE using a Cox model regression invoked by the function
estimate_vaccineff, which returns the object
vaccineff.
The proportional hazard assumption can be tested both through the
Schoenfeld test and visually using the plot method by
setting type = "loglog".
# Create `vaccineff_data`
vaccineff_data <- make_vaccineff_data(
  data_set = cohortdata,
  outcome_date_col = "death_date",
  censoring_date_col = "death_other_causes",
  vacc_date_col = "vaccine_date_2",
  vaccinated_status = "v",
  unvaccinated_status = "u",
  immunization_delay = 15,
  end_cohort = as.Date("2021-12-31"),
  match = TRUE,
  exact = "sex",
  nearest = c(age = 1)
)

# Estimate VE
ve <- estimate_vaccineff(vaccineff_data, at = 180)

# Print summary of VE
summary(ve)
#> Vaccine Effectiveness at 180 days computed as VE = 1 - HR:
#>      VE lower.95 upper.95
#>  0.7109   0.5245   0.8243
#>
#> Schoenfeld test for Proportional Hazards assumption:
#> p-value = 0.0631

# Generate loglog plot to check proportional hazards
plot(ve, type = "loglog")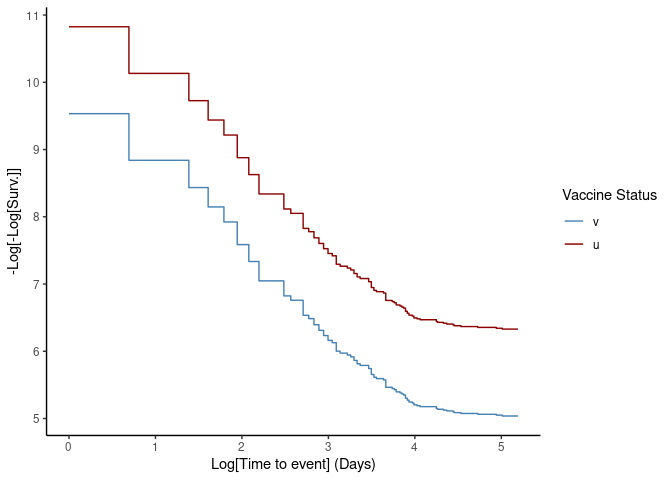
More details on how to use {{ packagename }} can be found in the online documentation as package vignettes, and in the articles “Get Started with vaccineff” and “Introduction to cohort design with vaccineff”.
To report a bug or to request a new feature please open an issue.
Contributions to {{ packagename }} are welcomed. Contributions are welcome via pull requests.
Contributors to the project include:
Authors: David Santiago Quevedo and Zulma M. Cucunubá (maintainer)
Contributors: Geraldine Gómez, Pratik Gupte, Érika J. Cantor, Santiago Loaiza, Jaime A. Pavlich-Mariscal, Hugo Gruson, Chris Hartgerink, Felipe Segundo Abril-Bermúdez, Joshua W. Lambert, Julian Otero
Please note that the {{ packagename }} project is released with a Contributor Code of Conduct. By contributing to this project, you agree to abide by its terms.